Model monitoring user flow#
This page gives an overview of the model monitoring feature. See a complete example in the tutorial Model monitoring and drift detection.
Note
If you are using the CE version, see Legacy model monitoring.
APIs#
The model monitoring APIs are configured per project. The APIs are:
enable_model_monitoring()— brings up the controller and schedules it according to thebase_period; deploys the writer.set_model_monitoring_function()— Update or set a monitoring function to the project. (Monitoring does not start until the function is deployed.)create_model_monitoring_function()— creates a function but does not set it. It's useful for troubleshooting, since it does not register the function to the project.list_model_monitoring_functions()— Retrieves a list of all the model monitoring functions.remove_model_monitoring_function()— Removes the specified model-monitoring-app function from the project and from the DB.set_model_monitoring_credentials()— Sets the Kafka or SQL credentials to be used by the project's model monitoring infrastructure functions.disable_model_monitoring()— disables the controller.
Enable model monitoring#
Enable model monitoring for a project with enable_model_monitoring().
The controller runs, by default, every 10 minutes, which is also the minimum interval.
You can modify the frequency with the parameter base_period.
To change the base_period, first run disable_model_monitoring, then run enable_model_monitoring
with the new base_period value.
project.enable_model_monitoring(base_period=1)
Log the model with training data#
See the parameter descriptions in log_model().
This example uses a pickle file.
model_name = "RandomForestClassifier"
project.log_model(
    model_name,
    model_file="./assets/model.pkl",
    training_set=train_set,
    framework="sklearn",
Import, enable monitoring, and deploy the serving function#
Use the v2_model_server serving function from the MLRun function hub.
Add the model to the serving function's routing spec (add_model()),
enable monitoring on the serving function (set_tracking()),
and then deploy the function (deploy_function()).
The result of this step is that the model-monitoring stream pod writes data to Parquet, by model endpoint. Every base period, the controller checks for new data and if it finds, sends it to the relevant app.
# Import the serving function
serving_fn = import_function(
    "hub://v2_model_server", project=project_name, new_name="serving"
)

serving_fn.add_model(
    model_name, model_path=f"store://models/{project_name}/{model_name}:latest"
)

# enable monitoring on this serving function
serving_fn.set_tracking()

serving_fn.spec.build.requirements = ["scikit-learn"]

# Deploy the serving function
project.deploy_function(serving_fn)
Invoke the model#
Invoke the model function with invoke().
model_name = "RandomForestClassifier"
serving_1 = project.get_function("serving")
0
for i in range(150):
    # data_point = choice(iris_data)
    data_point = [0.5, 0.5, 0.5, 0.5]
    serving_1.invoke(
        f"v2/models/{model_name}/infer", json.dumps({"inputs": [data_point]})
    )
    sleep(choice([0.01, 0.04]))
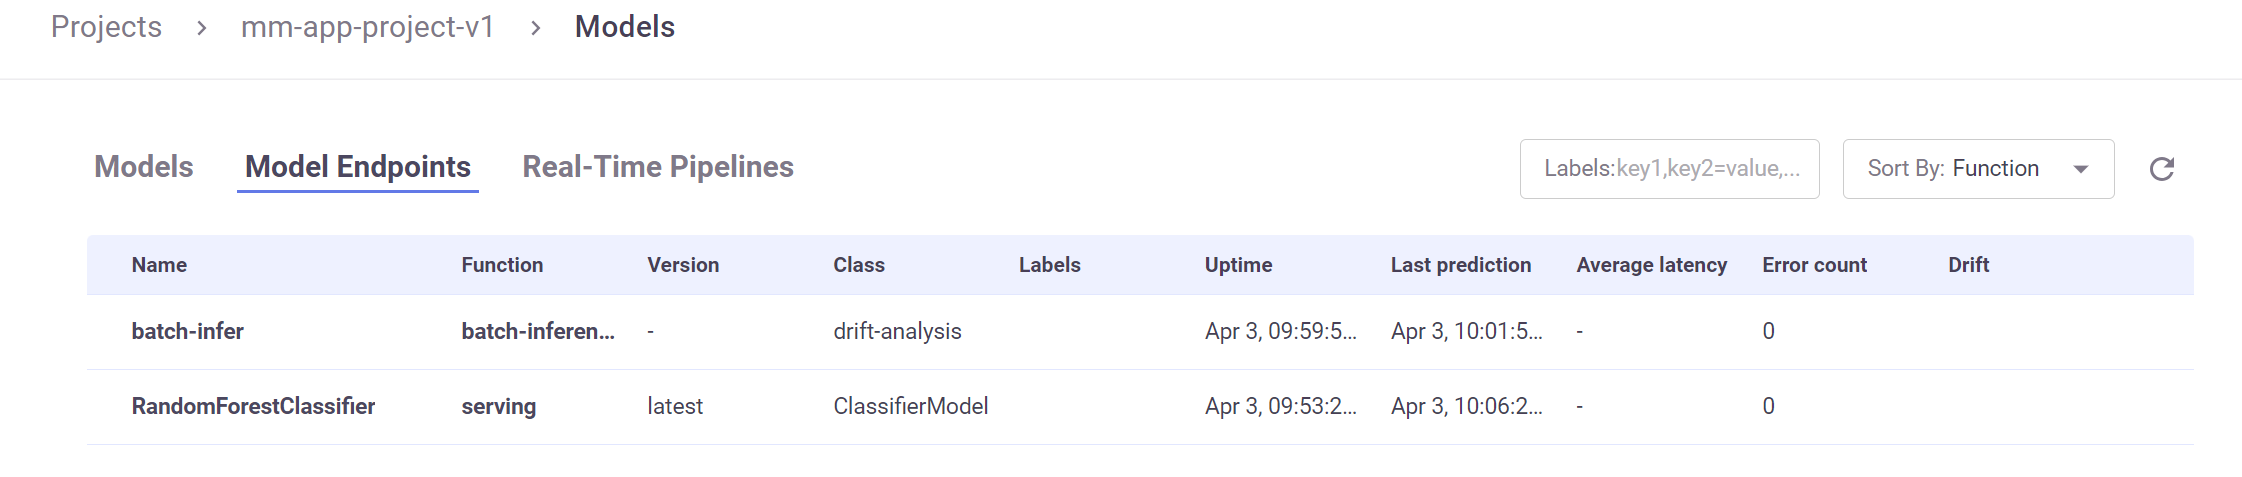
After invoking the model, you can see the model endpoints and minimal meta data (for example, last prediction and average latency) in the Models | Model Endpoints page.
You can also see the basic statistics in Grafana.
Register and deploy the model-monitoring app#
The next step is to deploy the model-monitoring job to generate the full meta data.
Add the monitoring function to the project using set_model_monitoring_function().
Then, deploy the function using deploy_function().
First download the demo_app.
my_app = project.set_model_monitoring_function(
    func="./assets/demo_app.py",
    application_class="DemoMonitoringApp",
    name="myApp",
)

project.deploy_function(my_app)
You can use the MLRun built-in class, EvidentlyModelMonitoringApplicationBase, to integrate Evidently as an MLRun function and create MLRun artifacts.
See the Model monitoring and drift detection tutorial.
Invoke the model again#
The controller checks for new datasets every base_period to send to the app. Invoking the model a second time ensures that the previous
window closed and therefore the data contains the full monitoring window. From this point on, the applications are triggered by the controller.
From this point on, the applications are triggered by the controller. The controller checks the Parquet DB every 10 minutes (or non-default
base_period) and streams any new data to the app.
model_name = "RandomForestClassifier"
serving_1 = project.get_function("serving")

for i in range(150):
    data_point = choice(iris_data)
    # data_point = [0.5,0.5,0.5,0.5]
    serving_1.invoke(
        f"v2/models/{model_name}/infer", json.dumps({"inputs": [data_point]})
    )
    sleep(choice([0.01, 0.04]))
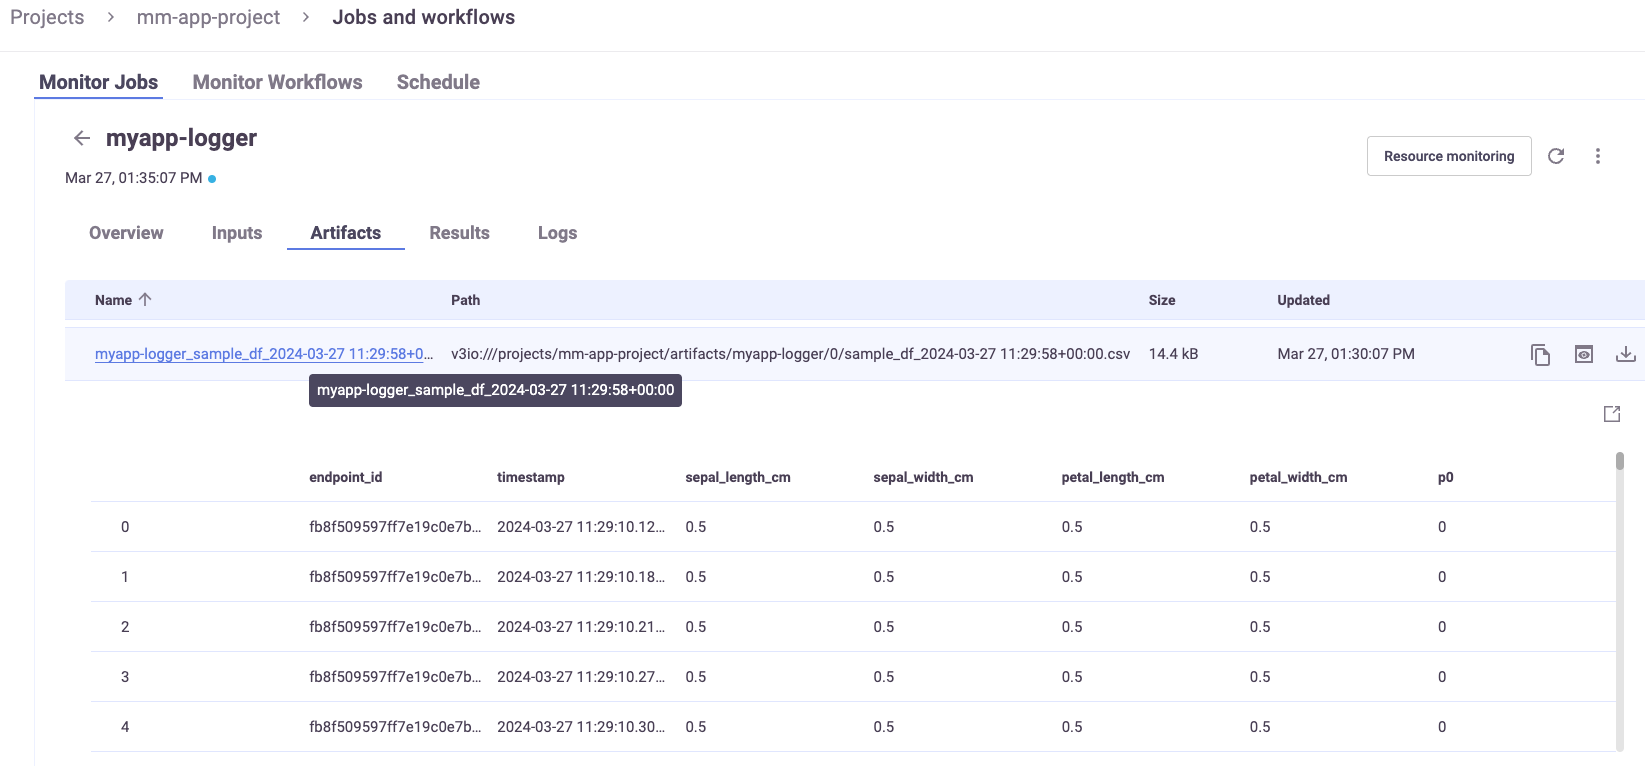
Now you can view the application results.
View model monitoring artifacts and drift in Grafana#
Monitoring details:
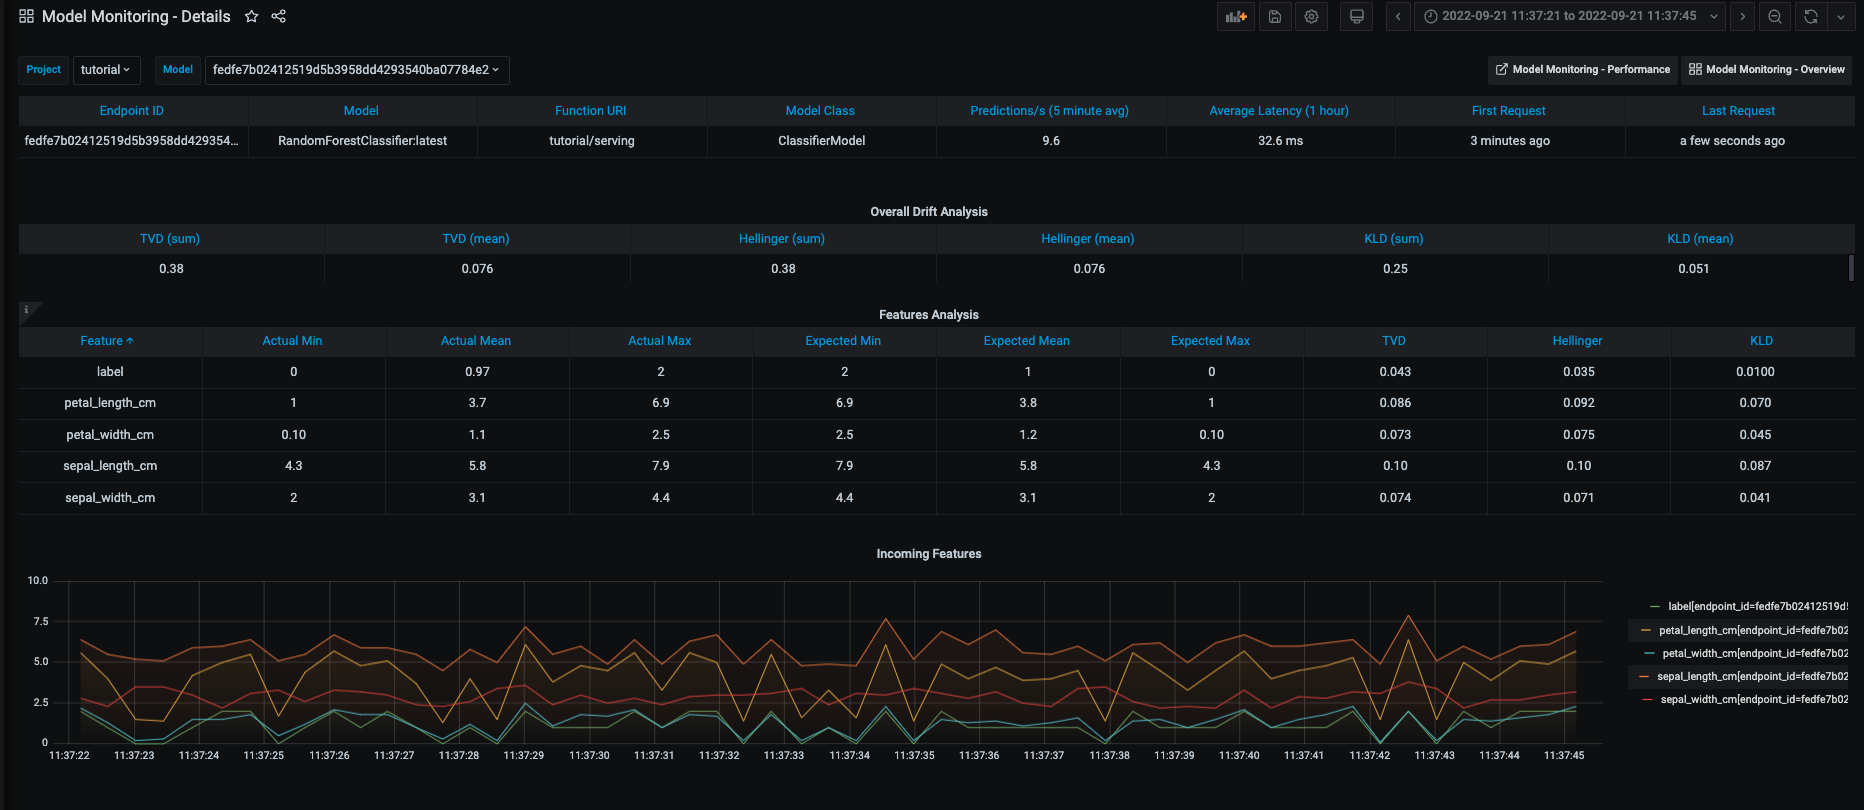
And drift and operational metrics over time:
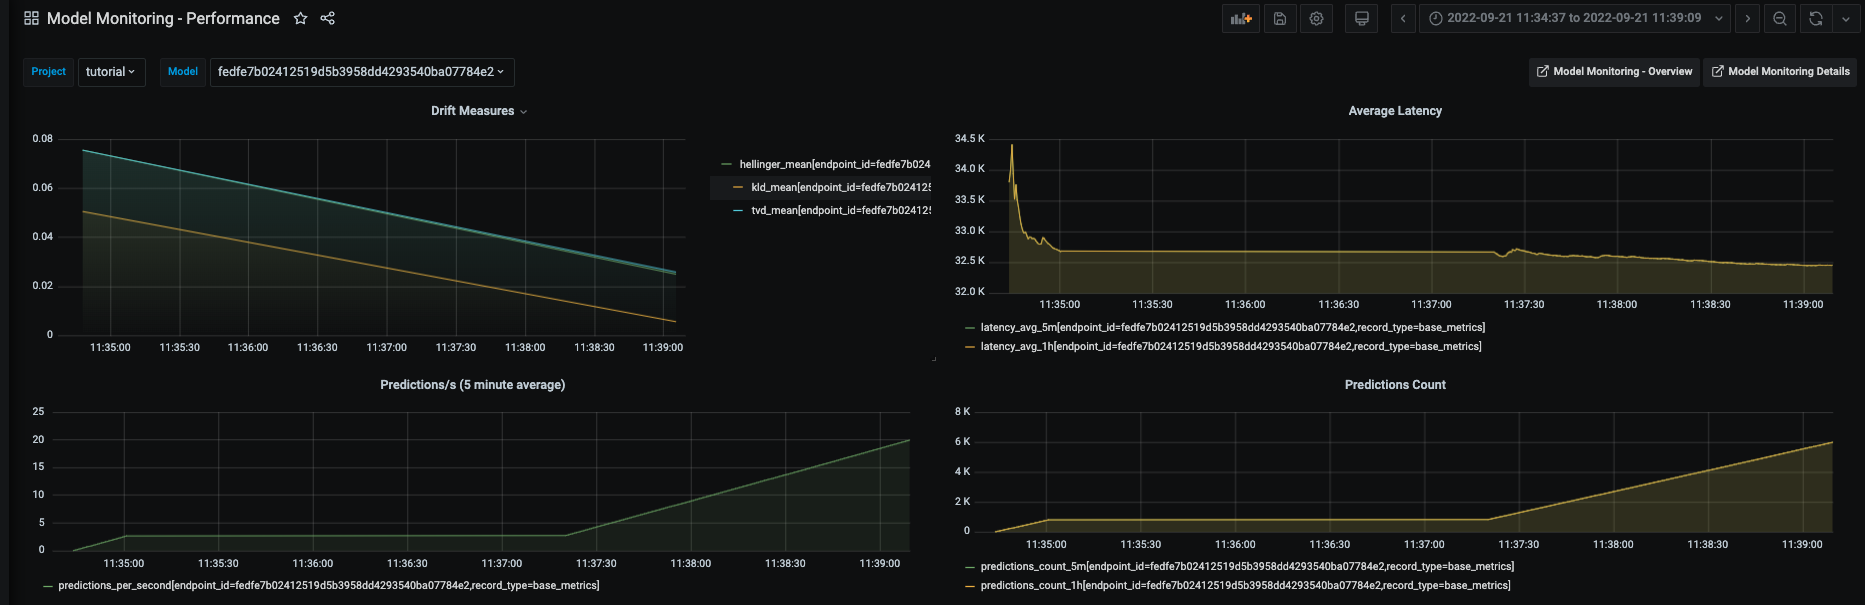
All of the Grafana dashboards are described in View model monitoring results in the platform UI and in Grafana.
Batch infer model-monitoring#
You can use the batch function (stored in the function hub) to evaluate data against your logged model without disturbing the model, for example a one-time evaluation of new data.
See more in the model monitoring tutorial.