Model monitoring#
In v1.6.0. MLRun introduces a new paradigm of model monitoring. The legacy mode is currently supported only for the CE version of MLRun.
The MLRun's model monitoring service includes built-in model monitoring and reporting capabilities. With monitoring you get out-of-the-box analysis of:
Continuous Assessment: Model monitoring involves the continuous assessment of deployed machine learning models in real-time. It's a proactive approach to ensure that models remain accurate and reliable as they interact with live data.
Model performance: Machine learning models train on data. It is important you know how well they perform in production. When you analyze the model performance, it is important you monitor not just the overall model performance, but also the feature-level performance. This gives you better insights for the reasons behind a particular result.
Data drift: The change in model input data that potentially leads to model performance degradation. There are various statistical metrics and drift metrics that you can use to identify data drift.
Concept drift: The statistical properties of the target variable (what the model is predicting) change over time. In other words, the meaning of the input data that the model was trained on has significantly changed over time, and no longer matches the input data used to train the model. For this new data, accuracy of the model predictions is low. Drift analysis statistics are computed once an hour. See more details in Concept Drift.
Operational performance: The overall health of the system. This applies to data (e.g., whether all the expected data arrives to the model) as well as the model (e.g., response time and throughput).
You can set up notifications on various channels once an issue is detected. For example, notification to your IT via email and Slack when operational performance metrics pass a threshold. You can also set-up automated actions, for example, call a CI/CD pipeline when data drift is detected and allow a data scientist to review the model with the revised data
Architecture#
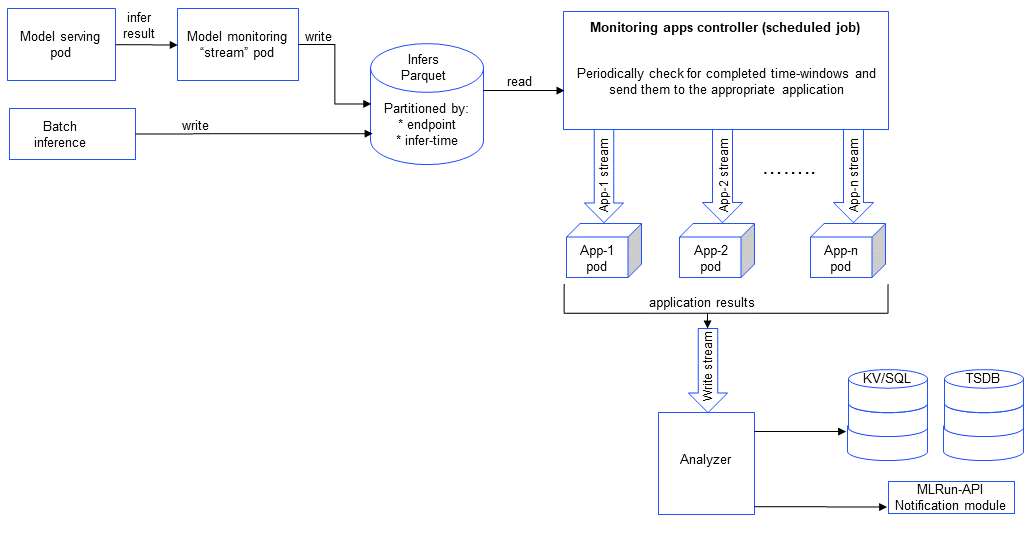
The model monitoring process flow starts with collecting operational data from a function in the model serving pod. The model
monitoring stream pod forwards data to a Parquet database.
The controller periodically checks the Parquet DB for new data and forwards it to the relevant application.
Each monitoring application is a separate nuclio real-time function. Each one listens to a stream that is filled by
the monitoring controller on each base_period interval.
The stream function examines
the log entry, processes it into statistics which are then written to the statistics databases (parquet file, time series database and key value database).
The monitoring stream function writes the Parquet files using a basic storey ParquetTarget. Additionally, there is a monitoring feature set that refers
to the same target. You can use get_offline_features to read the data from that feature set.
In parallel, an MLRun job runs, reading the parquet files and performing drift analysis. The drift analysis data is stored so that the user can retrieve it in the Iguazio UI or in a Grafana dashboard.
When you enable model monitoring, you effectively deploy three components:
application controller function: handles the monitoring processing and the triggers the apps that trigger the writer. The controller is a scheduled batch job whose frequency is determined by
base_period.stream function: monitors the log of the data stream. It is triggered when a new log entry is detected. The monitored data is used to create real-time dashboards, detect drift, and analyze performance.
writer function: writes to the database and outputs alerts.
Common terminology#
The following terms are used in all the model monitoring pages:
Total Variation Distance (TVD) — The statistical difference between the actual predictions and the model's trained predictions.
Hellinger Distance — A type of f-divergence that quantifies the similarity between the actual predictions, and the model's trained predictions.
Kullback–Leibler Divergence (KLD) — The measure of how the probability distribution of actual predictions is different from the second model's trained reference probability distribution.
Model Endpoint — A combination of a model and a runtime function that can be a deployed Nuclio function or a job runtime. One function can run multiple endpoints; however, statistics are saved per endpoint.
In this section