
Model monitoring tutorial#
This tutorial illustrates the basic model monitoring capabilities of MLRun: Deploying a model to a live endpoint (model monitoring endpoint); Deploying two model-monitoring applications, one of them based on the Evidently service / OSS; Configuring alerts on data-drift; Exercising the deployment with invocations, noticing the calculated drift results, the UI feedback and the triggered alerts.
Make sure you went over the basics in MLRun Quick Start Tutorial.
In this tutorial:
See also
Preparations#
Import mlrun and install the Evidently package (restart the kernel after install). You can optionally comment the install command if Evidently is already installed.
import mlrun
import os

# Install and use a version of evidently that was tested to be working with mlrun
from mlrun.model_monitoring.applications.evidently import SUPPORTED_EVIDENTLY_VERSION

# run this only once (restart the notebook after the install !!!)
!pip install "evidently=={SUPPORTED_EVIDENTLY_VERSION}"
Create mlrun project.
project = mlrun.get_or_create_project("tutorial", context="./", user_project=True)

# Needed when using S3/minio until AWS_ENDPOINT_URL_S3 env-var is adopted in mlrun
aws_url = os.environ.get("S3_ENDPOINT_URL")
if aws_url:
    os.environ["AWS_ENDPOINT_URL_S3"] = aws_url
    project.set_secrets({"AWS_ENDPOINT_URL_S3": aws_url})
Set datastore profiles and enable model monitoring#
Before you enable model monitoring, you must configure datastore profiles for TSDB and streaming endpoints. A datastore profile holds all the information required to address an external data source, including credentials.
Model monitoring supports Kafka and V3IO as streaming platforms, and TDEngine and V3IO as TSDB platforms.
See set_model_monitoring_credentials for more details.
from src.model_monitoring_utils import enable_model_monitoring

# If this project was running with MM enabled pre-1.8.0, disable the old model monitoring to update configurations
project.disable_model_monitoring(delete_stream_function=True)

enable_model_monitoring(project=project, base_period=2)
Log the model artifact#
See the parameter descriptions in log_model.
# Download the training set
import pandas as pd

train_set = pd.read_csv(
    "https://s3.us-east-1.wasabisys.com/iguazio/data/iris/iris_dataset.csv"
)

# Log the model
model_name = "RandomForestClassifier"
model_artifact = project.log_model(
    model_name,
    model_file="src/model.pkl",
    training_set=train_set,
    framework="sklearn",
    label_column="label",
)
Import, enable monitoring, and deploy the serving function#
Use the v2_model_server serving function from the MLRun function hub.
Add the model to the serving function's routing spec add_model(),
enable monitoring on the serving function set_tracking(),
and then deploy the function deploy_function().
The result of this step is that the model-monitoring stream pod writes data to Parquet, by model endpoint. Every base period, the controller checks for new data and if it finds, sends it to the relevant app.
# Import the serving function
serving_fn = mlrun.import_function(
    "hub://v2_model_server", project=project.name, new_name="monitoring-serving"
)

serving_fn.add_model(model_name, model_path=model_artifact.uri)

# enable monitoring on this serving function
serving_fn.set_tracking()

serving_fn.spec.build.requirements = ["scikit-learn~=1.5.1"]

# Deploy the serving function
project.deploy_function(serving_fn)
Invoke the model#
Invoke the model function with invoke().
import json
from time import sleep
from random import choice

iris_data = pd.read_csv(
    "https://s3.us-east-1.wasabisys.com/iguazio/data/iris/iris_to_predict.csv"
)
iris_data = iris_data.to_numpy().tolist()

model_name = "RandomForestClassifier"
serving_1 = project.get_function("monitoring-serving")
Test your serving model function
data_point = choice(iris_data)
serving_1.invoke(f"v2/models/{model_name}/infer", json.dumps({"inputs": [data_point]}))
{'id': '624743c1-3fa0-4f6d-a97d-456f65d5d07f',
 'model_name': 'RandomForestClassifier',
 'outputs': [0],
 'timestamp': '2025-05-20 12:24:59.542511+00:00',
 'model_endpoint_uid': '155a5799fbde404e9776c18839f76633'}
After invoking the model, you can see the model endpoints and minimal meta data (for example, last prediction) in the Models | Model Endpoints page.

You can also see the basic statistics in Grafana.
Register and deploy the model monitoring app#
The next step is to deploy the model-monitoring job to generate the full meta data.
Add the monitoring function to the project using set_model_monitoring_function().
Then, deploy the function using deploy_function().
This tutorial illustrates two monitoring apps:
The first application is a custom monitoring app (code provided).
The second application integrates with Evidently and captures its results as mlrun artifacts.
Learn how to write your own app in Writing a model monitoring application.
After deploying the jobs they show in the UI under Real-time functions (Nuclio).
Deploying monitoring app#
Set and deploy a monitoring application
my_app = project.set_model_monitoring_function(
    func="src/demo_app.py",
    application_class="DemoMonitoringApp",
    name="myApp",
)

project.deploy_function(my_app)
Deploying Evidently based app#
You can use the MLRun built-in class, EvidentlyModelMonitoringApplicationBase, to integrate Evidently as an MLRun function and create MLRun artifacts.
As prerequsite, you need to have an Evidently workspace and project. If you don't have one, create it now:
from mlrun.model_monitoring.applications.evidently import SUPPORTED_EVIDENTLY_VERSION
import os
import uuid
from src.evidently_app_setup import setup_evidently_project

evidently_workspace_path = os.path.join(
    mlrun.mlconf.artifact_path.replace("{{run.project}}", project.name),
    "evidently_workspace",
)

evidently_project_id = str(uuid.uuid4())
setup_evidently_project(
    evidently_project_id=evidently_project_id,
    evidently_workspace_path=evidently_workspace_path,
)
# register the second app named "evidently_app"

my_evidently_app = project.set_model_monitoring_function(
    func="src/evidently_app.py",
    image="mlrun/mlrun",
    requirements=[
        f"evidently=={SUPPORTED_EVIDENTLY_VERSION}",
    ],
    name="MyEvidentlyApp",
    application_class="DemoEvidentlyMonitoringApp",
    evidently_workspace_path=evidently_workspace_path,
    evidently_project_id=evidently_project_id,
)

project.deploy_function(my_evidently_app)
Configure alerts#
The monitoring infrastructure can trigger alerts when an event occurs
Define alert object#
First, define the alert itself, in this case, the alert will be for the model endpoint, it will occur for the result created by the evidently app
alert_name = "drift-alert-suspected"

# The summary you will see in the notification once it is invoked
alert_summary = "A drift was suspected"

# Choose the MODEL_ENDPOINT_RESULT for the model monitoring alert
entity_kind = mlrun.common.schemas.alert.EventEntityKind.MODEL_ENDPOINT_RESULT

# The event that will trigger the alert
event_name = mlrun.common.schemas.alert.EventKind.DATA_DRIFT_SUSPECTED
Construct a unique ID for the event ID using the endpoint, application name and result name
# Get the endpoint
endpoint = (
    mlrun.get_run_db()
    .list_model_endpoints(
        project=project.name,
        function_name="monitoring-serving",
        model_name="RandomForestClassifier",
    )
    .endpoints[0]
)
app_name = "MyEvidentlyApp"
result_name = "data_drift_test"

# Construct the unique ID for the event ID
result_endpoint = f"{endpoint.metadata.uid}.{app_name}.result.{result_name}"
Define notification list#
Define the notification list to send when the alert occurs. The example below creates a single slack notification. Note that this is an illustrative example, in an actual implementation you will need to create a slack webhook with a unique URL and pass that secret as a parameter
# Define the slack notification object
notification = mlrun.model.Notification(
    kind="slack",
    name="slack_notification",
    secret_params={
        "webhook": "https://hooks.slack.com/",
    },
).to_dict()

# Construct a list of notifications to be included in the alert config
notifications = [
    mlrun.common.schemas.alert.AlertNotification(notification=notification)
]
Create alert config#
Finally, create an alert configuration and store it in the project. The next time this event is detected, you will see an alert activation.
# Create the alert data to be passed to the store_alert_config function
alert_data = mlrun.alerts.alert.AlertConfig(
    project=project.name,
    name=alert_name,
    summary=alert_summary,
    severity=mlrun.common.schemas.alert.AlertSeverity.LOW,
    entities=mlrun.common.schemas.alert.EventEntities(
        kind=entity_kind, project=project.name, ids=[result_endpoint]
    ),
    trigger=mlrun.common.schemas.alert.AlertTrigger(events=[event_name]),
    notifications=notifications,
)

# And finally store the alert config in the project
project.store_alert_config(alert_data)
Let's generate traffic against the serving function model:
for i in range(1000):
    data_point = choice(iris_data)
    serving_1.invoke(
        f"v2/models/{model_name}/infer", json.dumps({"inputs": [data_point]})
    )
    sleep(choice([0.01, 0.04]))
View model monitoring artifacts and drift in the UI#
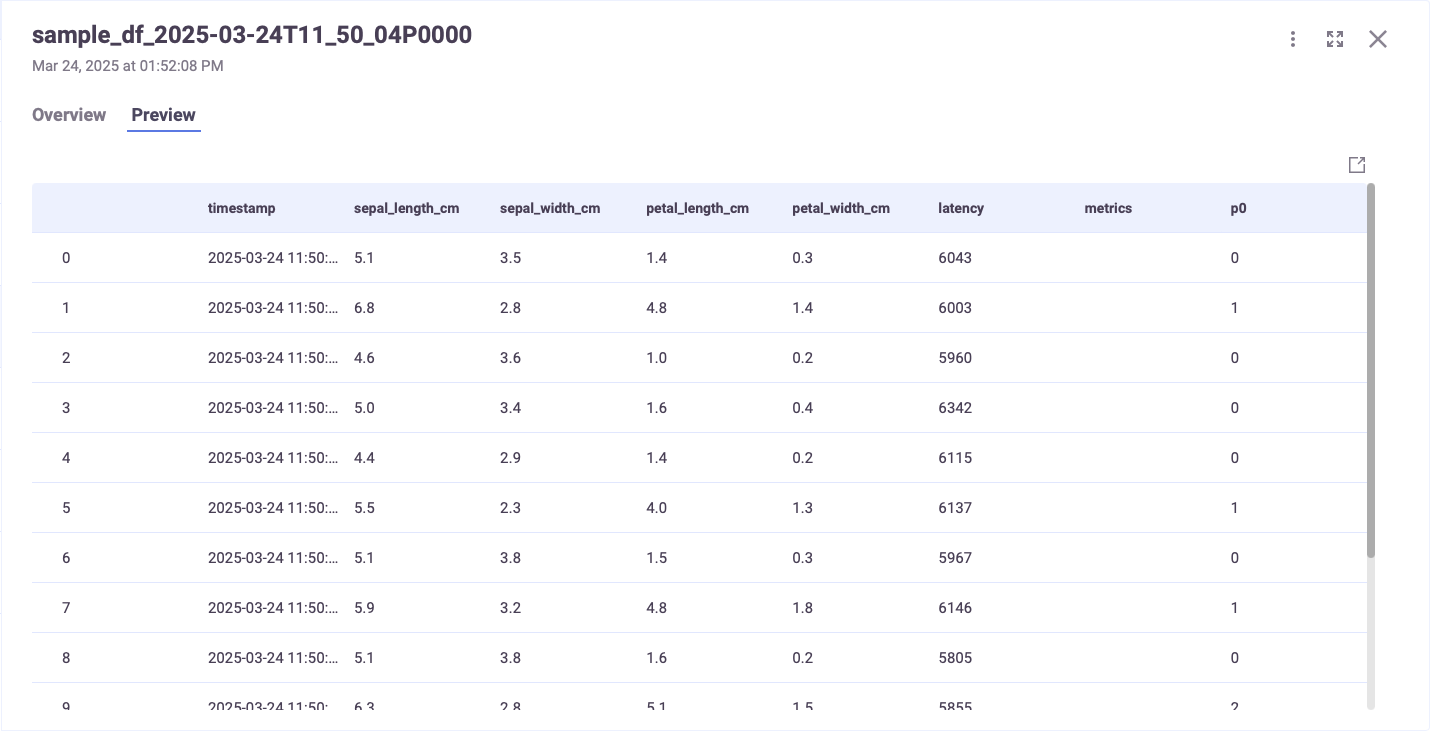
Now you can view the monitoring application results by clicking on the project Artifacts tab:
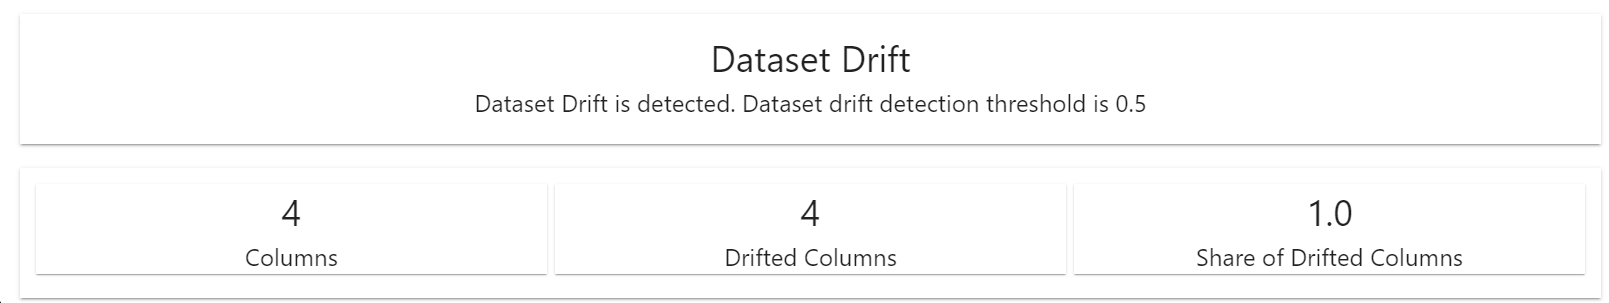
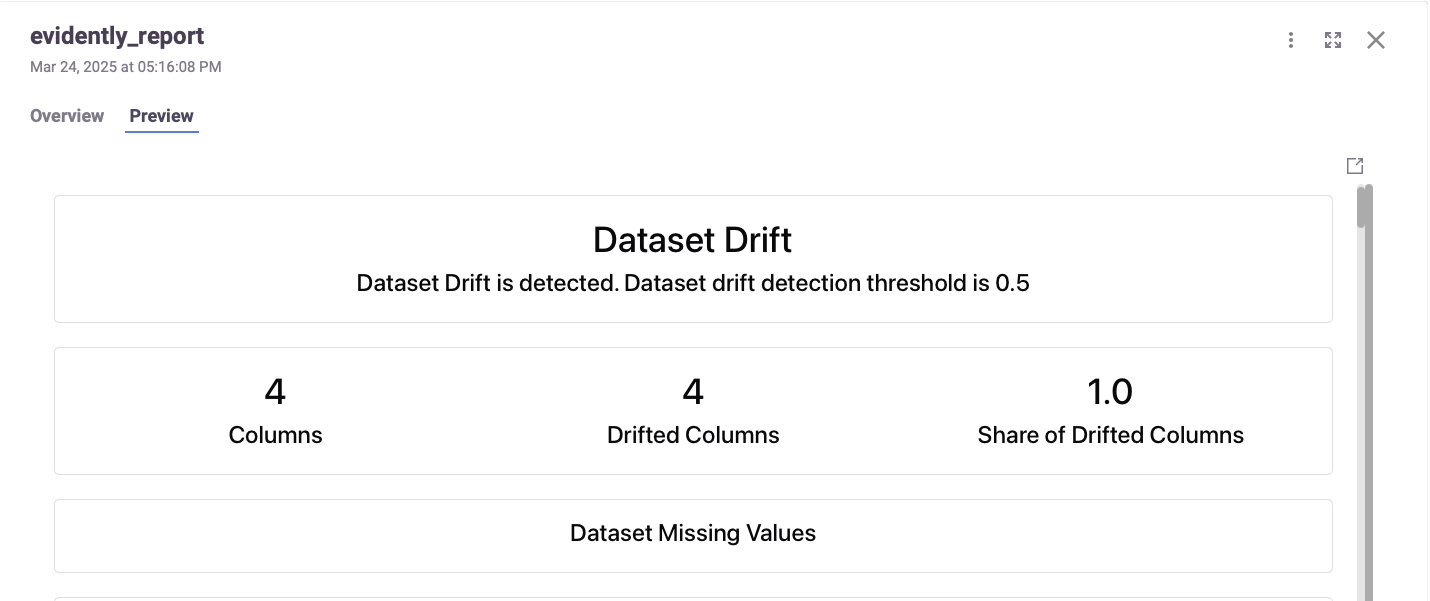
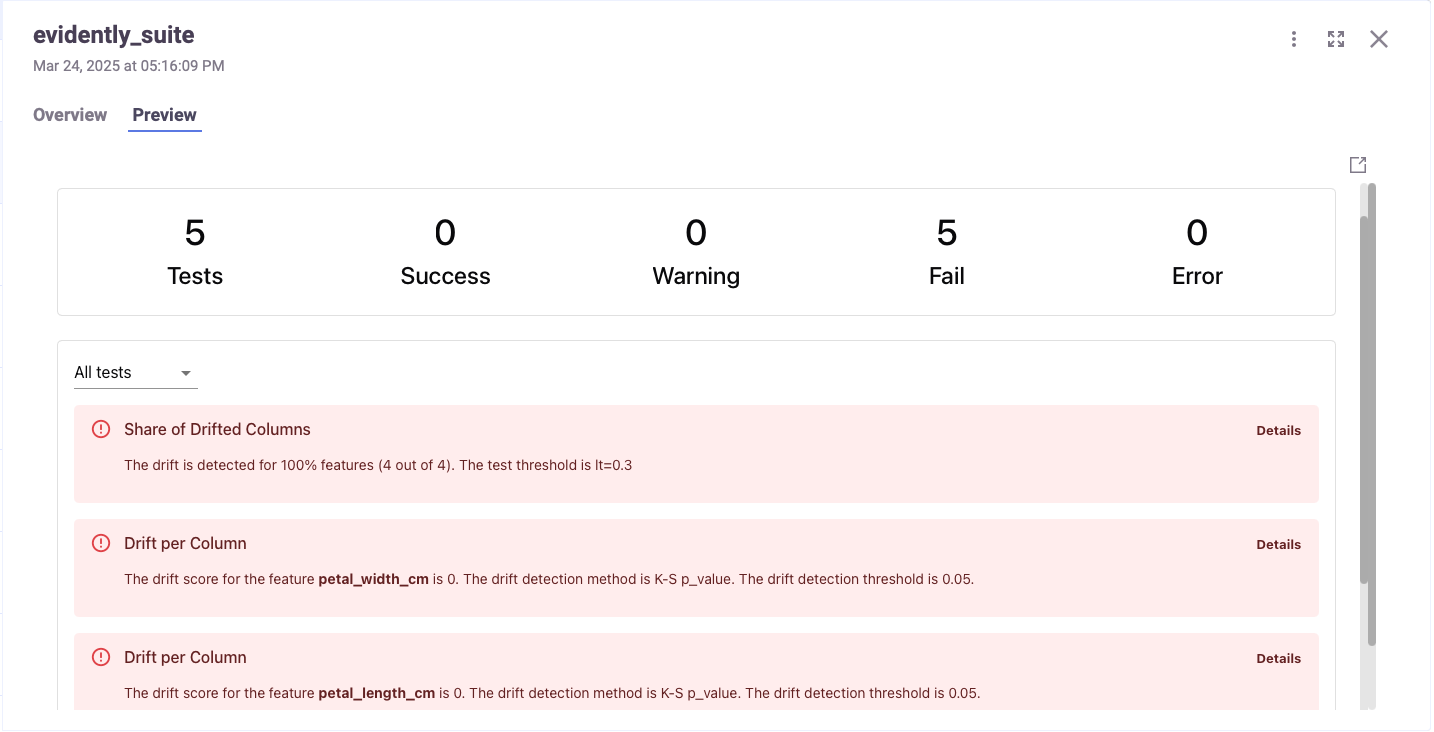
And if you've used Evidently:
For more information on the UI, see Model monitoring using the platform UI.
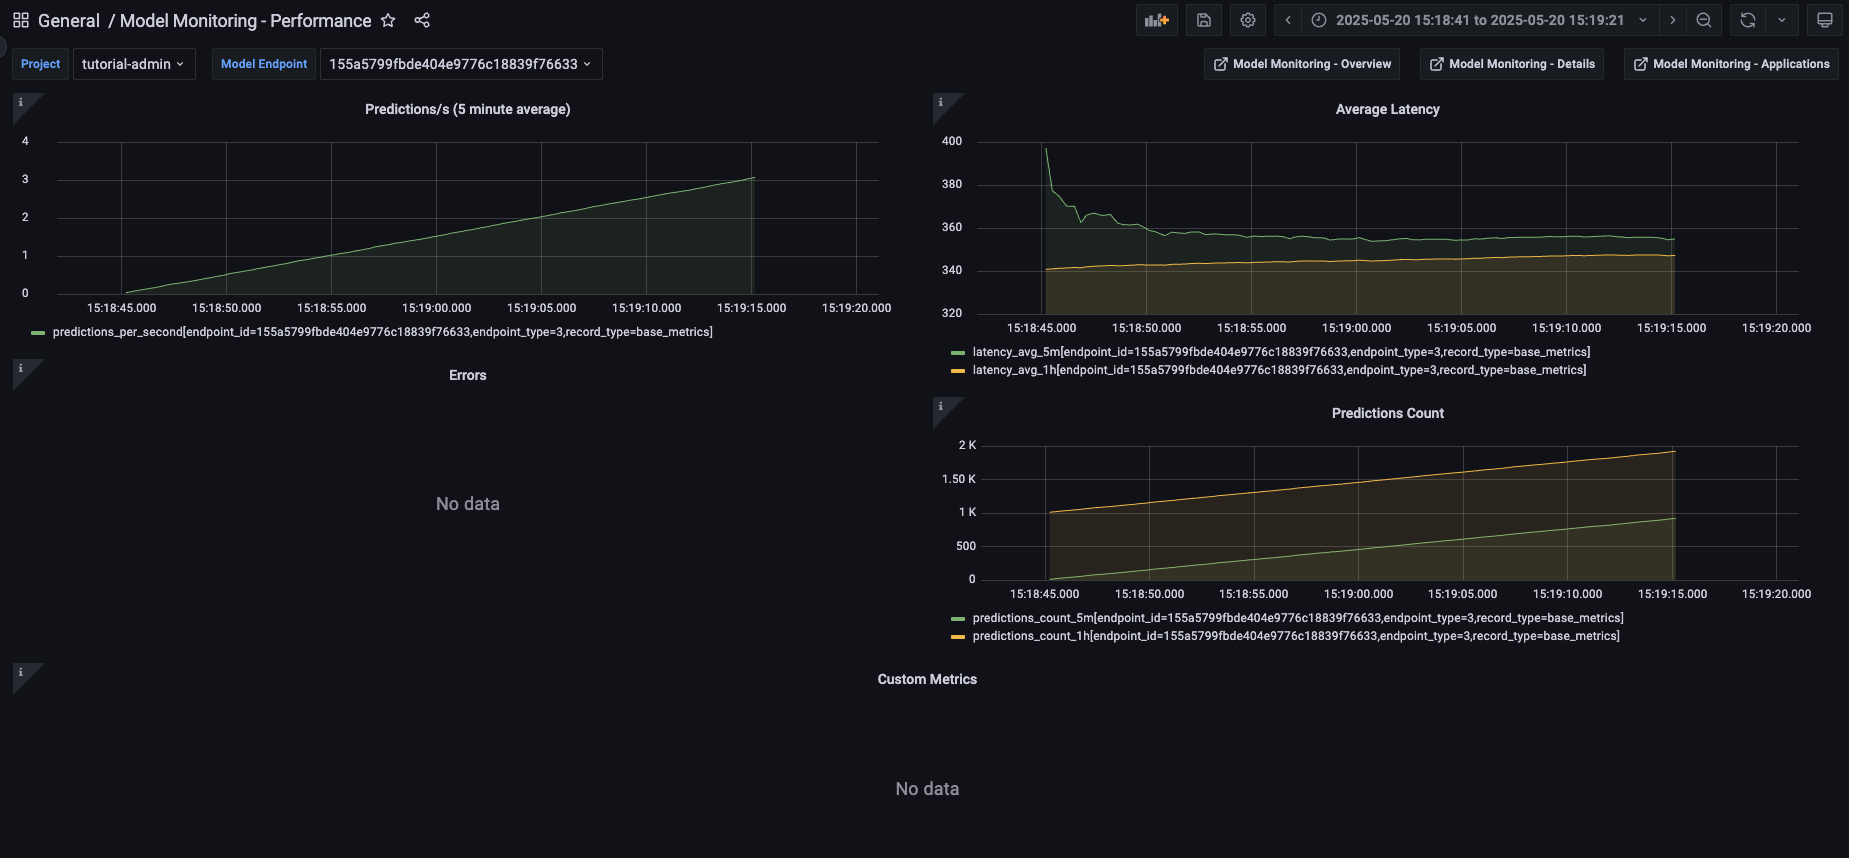
View model monitoring artifacts and drift in Grafana#
Monitoring details:
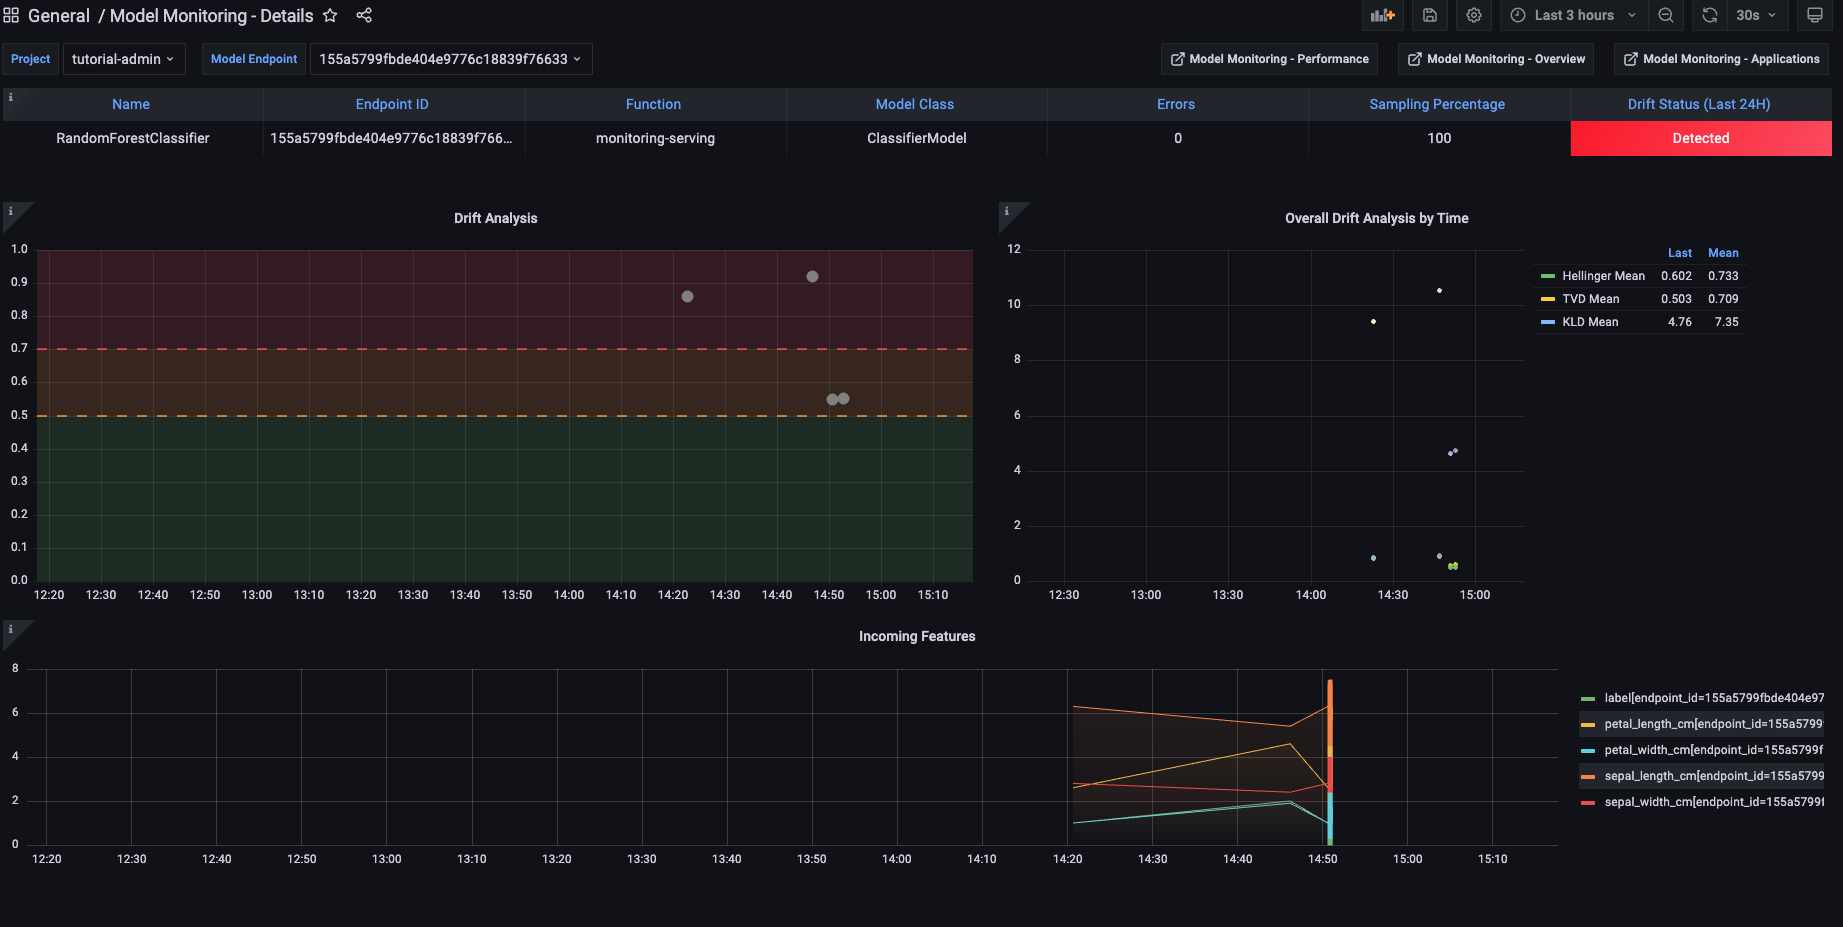
And drift and operational metrics over time:
All of the Grafana dashboards are described in View model monitoring results in Grafana.
Batch infer model-monitoring#
You can use the batch function (stored in the function hub) to evaluate data against your logged model without disturbing the model, for example a one-time evaluation of new data.
See more in Batch_inference and Batch inference and drift detection tutorial.
Done!#
Congratulations! You've completed Part 5 of the MLRun getting-started tutorial. Proceed to Part 6: Batch inference and drift detection to learn how to perform batch inference using a logged model and a prediction dataset.